CHECK OUT THE RESULTS OF MY 1st OFFICIAL DATA ANALYTICS SPRINT.
VISIT MY PAGE ON PUBLIC TABLEAU
Scroll down to read more about the sprint and the task.
EXERCISE: #1
Review of Data Analytics Growth in the NFL
(report conducted with Tableau, Excel, PPT & Canva)
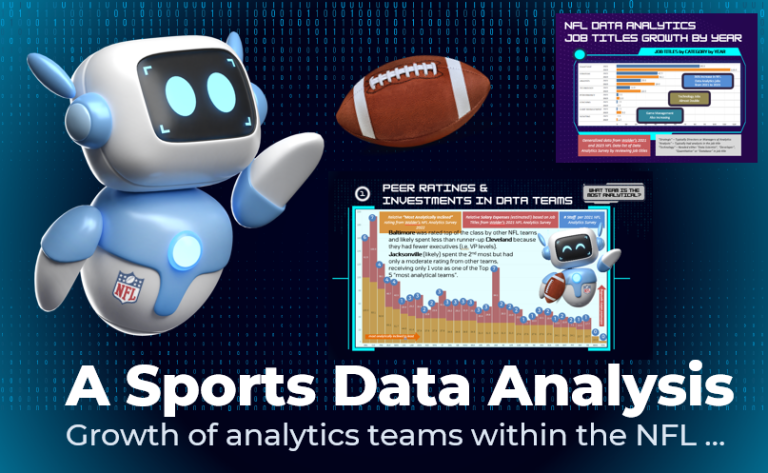
A PowerPoint presentation providing an analysis of the growth in Job Analytics positions in the NFL from 2021 to 2023. Data from articles written by Seth Walder of ESPN Analytics. Analysis uses some Excel for data maniuplation, Tableau for data visualizations, Canva and Powerpoint.
ENHANCEMENTS: In an upcoming Sprint (maybe the one starting 4/2), I am going to research current data analytics staffing using NFL team websites. Some have good information, some don’t. There seems to be growth since the 2023 survey.
EXERCISE: #2
Animating Players in Python
(various implementations with Python)

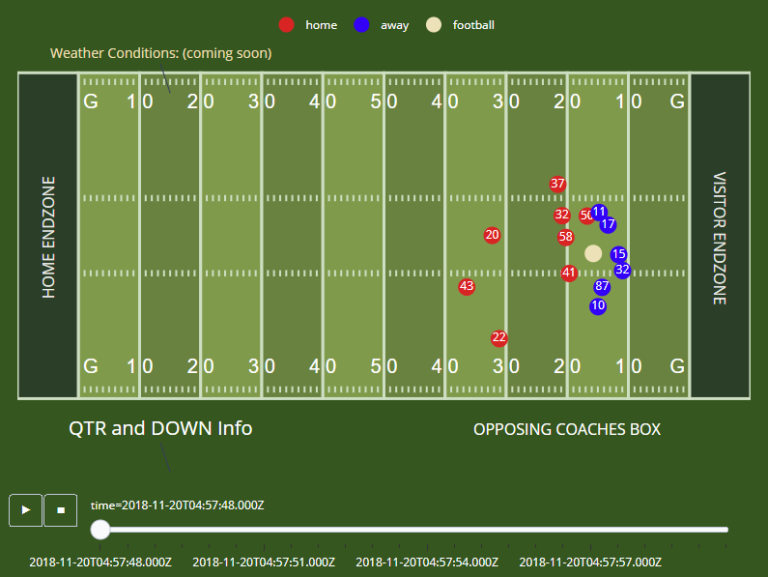
So in order to guide direction of the rollout of some sample Data Analytics projects that I am doing, I will be rolling them out in sprints. In preparation for my first 2-week sprint (beginning Mar 19), I completed a research project comparing the 3 ways you could animate players in Python: 1) an animated gif, 2) a video or 3) animated frames within a Python script (using Plotly). My choice is below – and I will be integrating it into the first sprint, due 02-April.
EXERCISE: #3
Preparing the Offense for the Rematch using Python & Tableau

SPRINT #1 (Mar 19): HERE’S THE AGILE STORY:
“I want to create reports for my HC and offensive team coaches that highlight elements of our last game against this opponent.
It must be easy to generate and enable the coaches to see animated plays.
Some presentation in Tableau is ok (plays will be on the web).”
NOTES:
2022 NFL data (2024 NFL Big Data contest) is the best in incorporating a mix of plays, but the worst in terms of available player tracking data (average play segment lengths are about 2 secs).
After not being able to find a source for 2022 player tracking data, I decided to just take some similar plays from 2018 and change some player names to make it look seamless.
The animation script is based on work I found in Kaggle by Ammar Alhaj Ali (link).
I removed the SQL and exported that data from Tableau – as I needed it for the data visualizations in Tableau and didn’t want to duplicate effort.
STANDUPS for Sprint #1

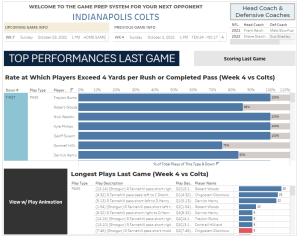
STANDUP #1 (Mar 24) I’ve completed the general framework for the reports for Downs, which should be the basis for all. Screenshot is available here: [view Report 1 image]
STANDUP #2 (Mar 25) Longest plays report is drafted and ready for integration into the Tableau Dashboard. Final major task is integrating the jump to a specific animated play from within a Tableau sheet in a dashboard. [view Report 2 image]
STANDUP #3 (Mar 26) Had to reformat the animation to fit Tableau dashboard window. Considered using an HTML pop-up w/ a small window size, but this is cleaner. Need to convert script to accept multiple input files and join them – as my animation script just used input from a single file. Thus, I can do data from 2018, 2021, and 2022 (at least). No blockers at the moment!
STANDUP #4 (Mar 28) A bit of an issue testing the 2022 data. Found a bug in the original script for 2018 data (starting line not actually correct) and then plotting is off. Formatting of additional data is done, so just need a few days to get the plotting issue resolved.
STANDUP #5 (Mar 29) OK, got 2021 data to load (utilizing 2018 script) and discovered 2022 data is just very short. Need to make a decision with respect to where I store my source data – manipulate it in Tableau and export or within Python. Regardless, it looks like I should have a way – next sprint update will be Monday. I also need to explore whether I can get complete tracking data through this R resource for the NFL – that would make things nicer.
STANDUP #6 (Apr 01) Tableau export to Python to create play animation is complete and tested. Need to integrate sample 2018 plays into Longest Plays dashboard, clean them up a bit, then work on the overall project dashboard to link to Longest Plays, Player Performance on Downs Report, and maybe add a few more. On Schedule to publish tomorrow (public Tableau or video).
STANDUP #7 (Apr 02) Just need to organize the Tableau Dashboards and get it published. Here’s a short video of work-in-progress.
RELEASE NOTES for Sprint #1
NFL OFFENSE GAME PREP REPORT

A data-driven report for offensive coaches and players to review strategic plays from the previous matchup with this opponent.
Leverages database design via Tableau, animated reporting using Python and Plotly. Web publishing facilitated via github and Tableau web page integration components.
FEATURES
- Data-oriented dashboard for offensive coaches to review strategic plays from last matchup
- Data managed in Tableau, so easy to add in additional data resources (e.g. weather condition for games, opposing team coach info, etc.)
- Simple download yields a small file of player tracking data for a specific play via Plotly (which features the ability to stop/start play and player info via hover
- Animated plays are published to the web and integrated into the Tableau reports for integration to dashboards – so coaches can see a recap of the play in animation
CREDITS
Credit to Ammar Alhaj Ali (link) for the player animation script using Plotly Express. I modified it for the look-and-feel, to add new football play meta data, and removed the SQL (but used those concepts in Tableau!).
All data courtesy of the NFL – taken from their 2024 and 2022 NFL Big Data competitions. Check that out at: NFL Football Operations
SPRINT #2 BEGINS.
So I think that I will set a pace of 3-weeks for my sprints, with 1 week for planning and 2 weeks dedicated to providing a new data analytics solution. Here are some of my initial plans for Sprint #2:
- Continue my research on data analytics staffing in sports teams
- Learn more about automating google searches with Python or R
- Learn more about screenscraping using Python
- Expand my Tableau dashboard and analytics skills
- Expand the Red Zone analysis
- Investigate pulling in additional resources (like the full play list for an NFL game from R)
- Continuing formal education (online classes) on AI, Machine Learning and Tableau
I am looking forward to what the online learning modules say about AI – there’s so much to learn there. I actually leveraged AI just a bit in my last sprint. As I was working to create a Landing Page to provide some explanation for the play animation, I at first sat down to code the CSS, then thought – can ChatGPT save me some time? So I logged in – said – “create me a landing page with a title and some text, using Tahoma font” – and it was perfect (had to code in the image).
A list of stories that could be included in Sprint #2. I’m already beginning to see some synergies:
- Complete the Red Zone Analaysis by using R to bring in complete NFL game play data – this will round out that analysis that I began in Sprint #1. This won’t fix the animation issue – this is just the outcome of each play for all of the games within a specific season.
- Compare and Contrast data analytics staffling levels and work products for hockey, basketball and American football. These are my three major areas of interest, so I think I will start there although there is a lot out there about soccer and certainly tons of data analytics underway related to baseball.
- Fouling Out a 7-Footer. So my Illini (my undergrad, and 20 minutes from my small hometown of Farmer City) went down in the Elite Eight against UConn and their 7’2″ center, Klingan, with Coach Underwood famously proclaiming – “we are going to continue to go right at him.” Are 7+’ers more likely or less likely to foul out? Are some players more susceptible than others? Are they called for fewer fouls than their shorter counterparts? A few of the possible questions.
THE CLOUD.
While I am a “low code” advocate – believing that an organization can most effectively leverage data analytics tools as new solutions become available via the cloud – my experience teaches me to be pragmatic. Having built a software platform, I understand marketing claims vs. reality, and I believe that having a deep understanding of the basics – like Python, R and SQL are essential to leveraging the advanced technologies of Tableau, ChatGPT, GenAI, etc.
Below I have listed the data analytics technologies in which I am specifically focused. Regression modeling, Machine Learning and generative AI modeling are some of the areas, in particular, that I am studying in more detail.
UPDATE: I just signed up for a 4-6 month Data Science certification program through IBM where I will get more experience with SQL, Tableau, Machine Learning and Generative AI tools.
- Python for data extraction
- R for data calculations
- SQL for relational database design and raw data access
- Tableau for data tables and data visualization
- RESTful APIs / JSON / PHP and Oracle APEX for presenting data
- Generative AI models with solutions like ChatGPT
"Over the course of the last 10 years, 15 years, Almost everyone would tell you ... It is vital that you learn how to program. in fact, it is almost exactly the opposite. It is our job to create computING technology, such that nobody has to program. ... Everybody in the world is now a Programmer. This is the miracle of artificial intelligence." (video)
CEO, NVIDIA, Jensen hugan, ceo Nvidia
EXERCISE: #4
Considering an NBA or NHL Growth in Analytics Study
I’m considering using Python to visit pro sports teams websites and download data. I can leverage Python, some of my web skills – and then upload the results into Tableau for analysis. I need to get into some regression analysis as part of that effort as well.
EXERCISE: #5
Blitz Strategy and Programming in R

Next, I plan to tackle RStudio for my next major project which will be recreating research done by an NFL Big Data runner-up who now works for the Cleveland Browns, Dom Borsani. His entry in 2023 seems to be one of the best examples of developing an analytics solution that can be used and adjusted every week of the NFL season.
BUSINESS PROCESS ENGINEER
While I understand the principles of BPR (Business Process Reengineering) and business transformation, I tend to find myself in new situations in which there are no existing business processes. I crave structure, so in these cases I create both documented processes to create structure and models to articulate our strategy. Here is one example – an overview of our eGov Strategies implementation efforts for new city and county websites:
- Kickoff Call w/ Project Leaders & Project Executive
- eGov Roadmap schedule and meetings
- eGov Roadmap (short-term plan for content / long-term plan for website)
- Agile Development of Custom Solutions
- Content Jumpstart
- Training and Website Soft Launch
In 1997, I created a “5 Phases of Government Websites” model that was featured in Government Technology magazine, the public sector’s leading technology trade magazine. It outlined how city and county websites would evolve from simple web pages with contact information to online services that that re-invent how government services are delivered using the Internet.
"The collaboration with the business has to be one of the pillars of any data and analytics organization. ... We shouldn't just build it, throw it over the wall, and assume good things will happen. ... We are internal consultants. You have to embrace the Change Management.
Paul Ballew, CHief Data & Analytics Officer, NFL - CXO Talk Podcast, 2022


