THIS PAGE HIGHLIGHTS MY EXPERIENCE IN THE DATA ANALYTICS ARENA. YOU ALSO GET SOME INSIGHT INTO MY EXPERIENCE AS A PROCESS ENGINEER, AS I ORGANIZED SOME EFFORTS USING AGILE. MOST OF THE WORK PRODUCTSARE RELATED TO MY COURSEWORK AND INDEPENDENT STUDY EFFORTS FOR DATA SCIENCE CERTIFICATION WITH AN IBM SPONSORED PROGRAM OFFERED THRU SIMPLILEARN.
TO VIEW ALMOST EVERYTHING, VISIT MY PAGE ON PUBLIC TABLEAU
REVIEWING THE DATA-DRIVEN
INITIATIVES OF US CITIES
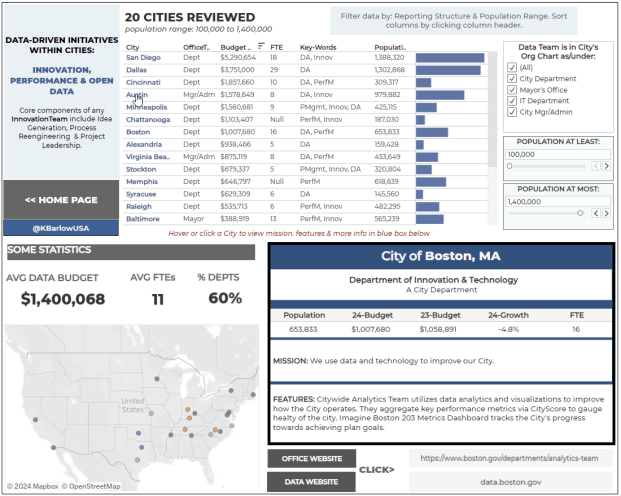
MAY 31, 2024: Here is a look at the data-driven initiatives of more than 20+ US Cities. With the rise of Open Data in 2014, data analytics became an important technology component for US cities. As Innovation & Performance Management initaitives became essential to those cities looking to be more innovative, a Data Analytics department became the next logical step.
DATA-DRIVEN INITIATIVES IN US 20+ US CITIES
This review looks at how Data Analytics teams are organized within select US Cities, and which cities are (right now) leading the charge.
CITY GOVERNMENT
BENCHMARKING PROJECT
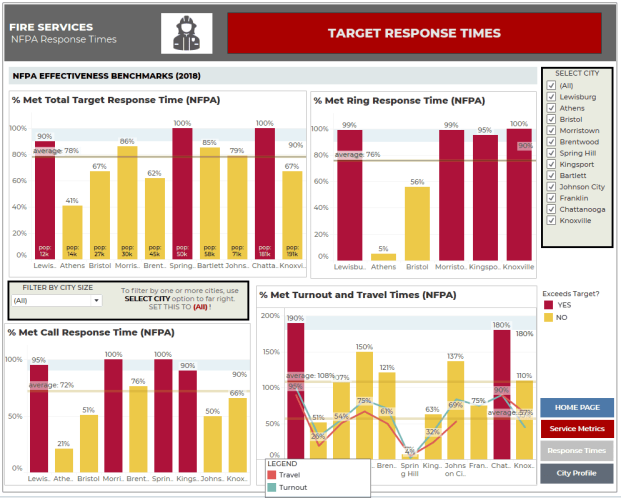
MAY 21, 2024: Another Independent Study effort, I took to the task of converting a few pages of a very comprehensive city government benchmarking effort – completed by the TN Municipal Technical Advisory Service (affiliated with the University of Tennessee – Knoxville) to be driven by Tableau. Check it out and let me know how it looks on your devices.
TENNESSEE MUNICIPAL BENCHMARKING
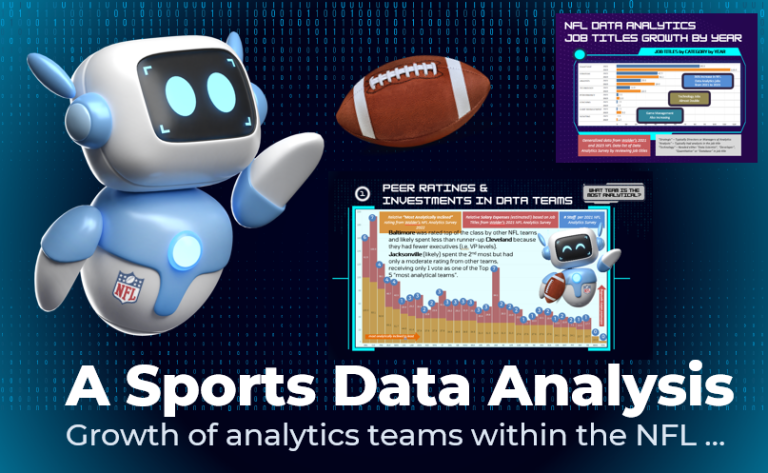
2024 NFL DATA ANALYTICS TEAM SURVEY –
MY MOST SIGNIFICANT DATA VISUALIZATION PROJECT TO DATE
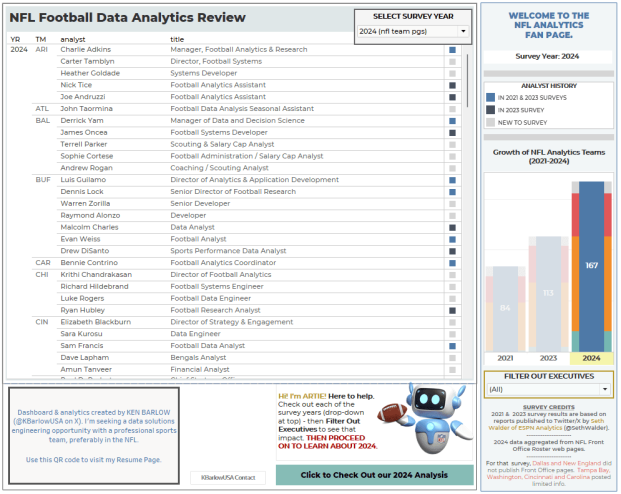
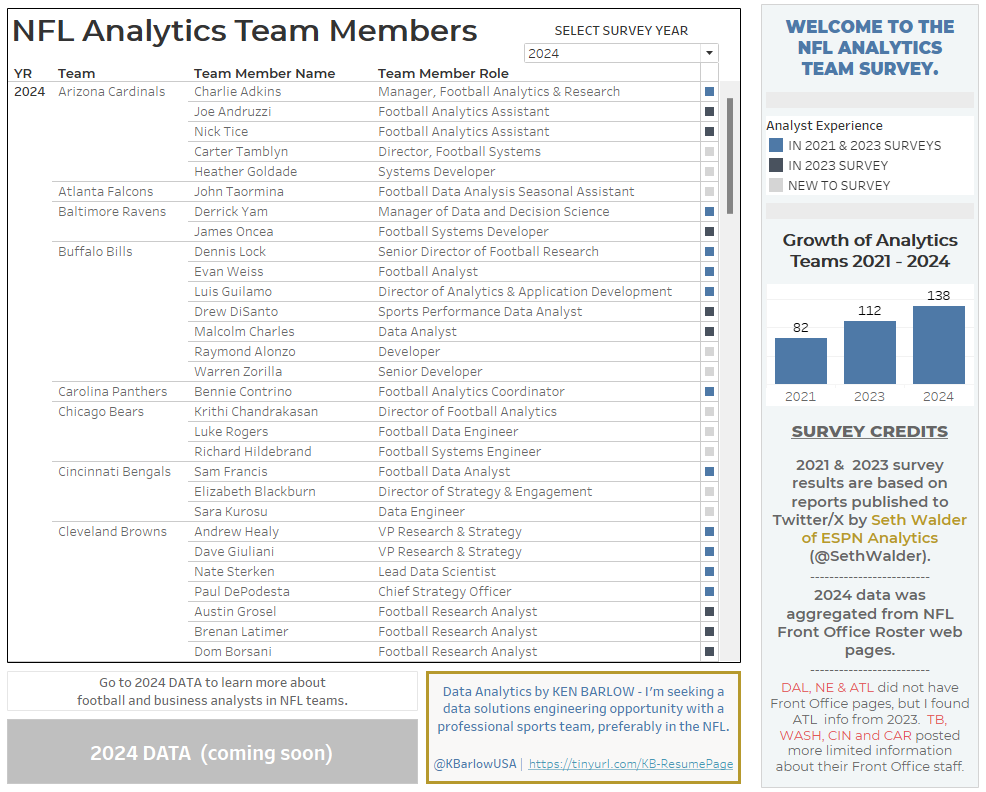
MAY 07, 2024: Just finishing up an Independent Study effort related to NFL Data Analytics. I call it the NFL Data Analytics Fan Page – and used Tableau, Python and some Excel to put this all together. Credit to Seth Walder of ESPN Analytics for the inspiration through his NFL Data Analytics surveys in 2021 and 2023. There is an online form for comments & suggestions.
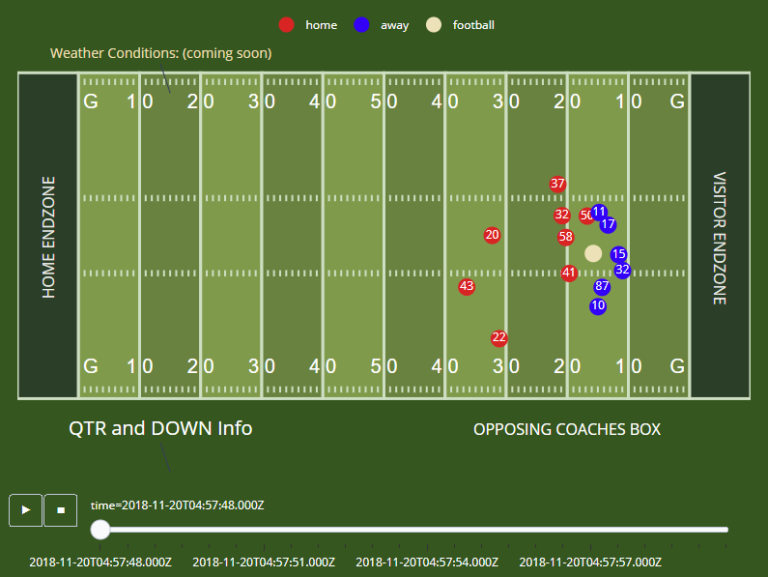
PREPARING AN NFL OFFENSE FOR A REMATCH
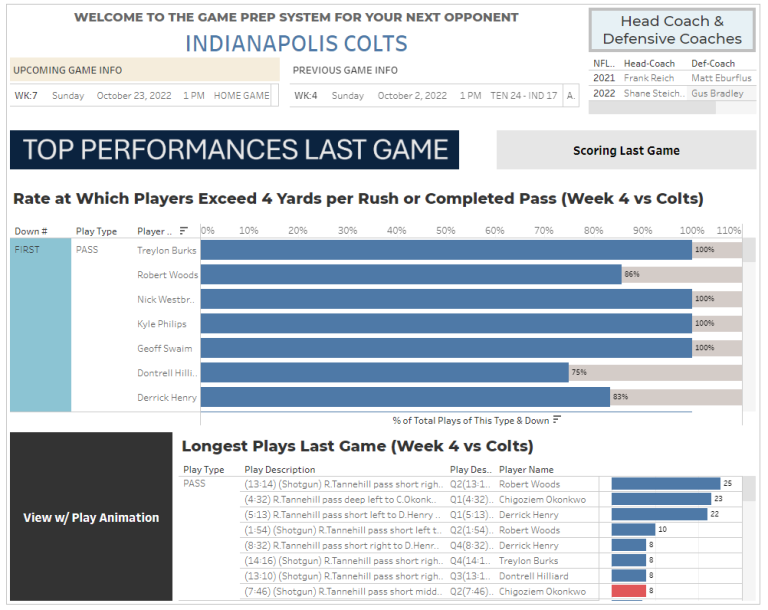
A data-driven report for offensive coaches and players to review strategic plays from the previous matchup and gain insight about this week’s opponent.
Leverages database design via Tableau, animated reporting using Python and Plotly. Web publishing facilitated via github and Tableau web page integration components.
FEATURES
- Data-oriented dashboard to review strategic plays
- Data managed in Tableau
- Simple download of player tracking data for input to python animtion script
- Animated plays published to the web and included in dashboard per pattern
VIDEO: View this Pat McAfee clip about the importance of Game Prep data.
Animating Players in Python (Python)

In preparation for sprint #1, I completed a research exercise to compare and contrast various options for implementing animations using player tracking data.
They are: 1) an animated gif, 2) a video or 3) animated frames within a Python script (using Plotly).
FEATURES
easily stop and start animation
hover over players to get additional player details
be designed to utilize player tracking data exported from Tableau
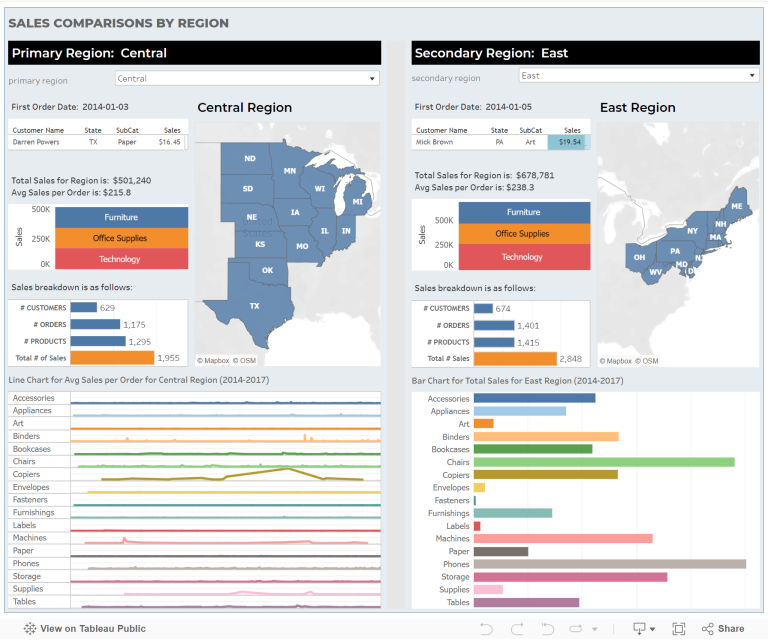
Sales Region Comparisons
(Tableau)

So for the Simplilearn Master’s Program – a collaborative Data Science Certification program with IBM – I was asked to create a sales dashboard in Tableau. See mockup and then my interpretation.
SPRINT EXAMPLE – HOW I MANAGED THE NFL DATA ANALYTICS TEAM SURVEY PROJECT

SPRINT
RELEASE NOTES
Software to Collect NFL
Data Analytics Team Information
(Python & Tableau)
FEATURES
- An automated system for collecting information about the make-up of current NFL data and business analytics teams. Utilizes official team websites to pull information by department, analyst name and title.
- Data can be screened to remove non-analytics team members by department (e.g. a financial analytics department) or by specific titles that are more technology than analytics (e.g. CRM).
- The system also counts total number of analytics employees for an organization along with total number of front-office staffers (per the website).
- Python script parses thru 2 different website design schemas currently used by NFL teams – one is more photo-intensive than the other. Only 3 teams did not have websites – New England Patriots and Dallas Cowboys. The Atlanta Falcons did not have a website but I found information in a very similar format that looks to be from 2023 – so I used that.
STANDUPs For the 2024 NFL Analytics Fan Page
- STANDUP #1 (Wed 4/24) Developed a couple of strategies in Python and Tableau to clean the data from 2024 – and associate to three different categories of analysts: executive, football and business.
- STANDUP #2 (Fri 4/26) Created an initial pass at the new Dashboard for the surveys and reviewed that the 2021 and 2023 data was listed correctly. Working on the 2nd dashboard now – a complete analysis of 2024 surveys that I pulled from the team websites.
- STANDUP #3 (Tues 4/30) Spent Mon and Tues refining the Landing Page for the Survey. Targeting end-of-week launch for Surveys (21, 23 & 24) + 2024 in-depth analysis.
- STANDUP #4 (Wed 5/01) Worked on drafting 2024 survey pages and its growth calculation. Easily done, but generates an extra column that I am trying to avoid.
- STANDUP #5 (Fri Wed 5/03) Completed 3 dashboards (comparative survey + 2024 survey + 2024 business). Added a 4th that provides “Create a Report functionality”.
- STANDUP #6 (Sat 5/04) Getting workbook published to Tableau Public over the weekend.
- STANDUP #7 (Mon 5/06) New workbook is published to Tableau Public and integrated into this website. I also decided it was a day to rework the Growth calculation and figured out how to do it without table calculations. DONE.
THE CLOUD.
I am a “low code” advocate. I am experienced and proficient in leveraging cloud-based software solutions to streamline operations and enhance efficiencies within an organization. In my opinon, the best predictive and prescriptive analytics tools will be easier to implement using the cloud than via traditional programming methods like SQL.
I am currently enrolled in a 4-6 month Master’s Program in Data Science (SimpliLearn in collaboration with IBM) in which I attend classes online and prove my aptitude through assessments and exercises – in topics ranging from SQL to TAbleau to Machine Learning to Generative AI.
Below I have listed the data analytics technologies in which I am specifically focused.
- Python for data extraction
- R for data calculations
- SQL for relational database design and raw data access
- Tableau for data tables and data visualization
- RESTful APIs / JSON / PHP and Oracle APEX for presenting data
- Machine Learning
- Generative AI models with solutions like ChatGPT
"Over the course of the last 10 years, 15 years, Almost everyone would tell you ... It is vital that you learn how to program. in fact, it is almost exactly the opposite. It is our job to create computING technology, such that nobody has to program. ... Everybody in the world is now a Programmer. This is the miracle of artificial intelligence." (video)
CEO, NVIDIA, Jensen hugan, ceo Nvidia
BUSINESS PROCESS ENGINEER
While I understand the principles of BPR (Business Process Reengineering) and business transformation, I tend to find myself in new situations in which there are no existing business processes. I crave structure, so in these cases I create both documented processes to create structure and models to articulate our strategy. Here is one example – an overview of our eGov Strategies implementation efforts for new city and county websites:
- Kickoff Call w/ Project Leaders & Project Executive
- eGov Roadmap schedule and meetings
- eGov Roadmap (short-term plan for content / long-term plan for website)
- Agile Development of Custom Solutions
- Content Jumpstart
- Training and Website Soft Launch
In 1997, I created a “5 Phases of Government Websites” model that was featured in Government Technology magazine, the public sector’s leading technology trade magazine. It outlined how city and county websites would evolve from simple web pages with contact information to online services that that re-invent how government services are delivered using the Internet.
"The collaboration with the business has to be one of the pillars of any data and analytics organization. ... We shouldn't just build it, throw it over the wall, and assume good things will happen. ... We are internal consultants. You have to embrace the Change Management.
Paul Ballew, CHief Data & Analytics Officer, NFL - CXO Talk Podcast, 2022
